Proteome Quality Index
Contents
3.6. Proteome Quality Index
Reducing bias and improving data and research quality in computational biology is a broad and active area of research. This section explains one such effort which I contributed to: the Proteome Quality Index (PQI)[2], which provides a variety of individual quality metrics as well as a “star rating” for complete genome sequences.
Contributions in this section
The Proteome Quality Index paper was created as a joint project between the Computational Biology group (then) at Bristol. I contributed to ideas for metrics, code to calculate some of these metrics, and paper editing.
3.6.1. Introduction
Although sequencing, assembly, and protein annotation of new genomes is a challenging and complex task, there are now thousands of organisms with sequenced genomes and identified protein sequences (proteomes). These proteomes can vary hugely in quality; in creating a daily-updated phylogenetic tree, sTOL (sequenced Tree Of Life), it was found that many sequenced genomes were missing vital proteins due to poor sequencing[149]. This could have a far-reaching impact on research results since such genomes are reused by many researchers, particularly in comparative genomics analyses, where omissions of whole proteins and poor accuracy of others are likely to affect results. While quality control and data submission guidelines were more developed in other areas of computational biology, similar guidelines for genome quality were lacking.
In response, eleven different proteome quality metrics were developed, applied to 3,213 proteomes at the time of writing, and a website built to display the results, as well as being presented in a paper[2]. This website was intended to be both a way for users of genome data to look up the quality of a genome in advance of some research and, more importantly as a talking point for quality guidelines for genomes with known proteins. Since the development of PQI, a twelfth metric, DOGMA[150], was added to the website, donated by the Bornberglab.
3.6.2. PQI metrics
PQI’s original eleven metrics were either local i.e. “clade-based” (in which proteomes are compared to similar organisms) or global (in which case it is compared to all other proteomes). A clade is a group of organisms that consists of a common ancestor and all its descendants, i.e. is a branch on the tree of life[151], so an appropriate ancestor must be chosen to define the clade. For PQI, since the purpose of these clades was to compare its’ constituent proteomes, we wanted clades that had similar variability. This was achieved by choosing parent nodes that are at least 0.01 in branch length away from the proteome (leaf node), and such that the clade contains at least 10 species. Trees and branch lengths to carry out these calculations were taken from sToL[149]. For clade-based metrics, proteomes score well if they have similar scores to the rest of the clade. Descriptions of the 12 different metrics currently in PQI can be seen in Table 3.3.
Metric name |
Type |
Description |
Notes |
|---|---|---|---|
1. Percentage X-content |
Global |
Percentage of proteome with amino acids denoted by ‘X’, excluding the first residue of each protein. |
Amino acids that cannot be identified, or can have more than one value are represented by an ‘X’ in the amino acid sequence[152]. This occurs when coverage of the sequencing is low. Uncertainty in translation start sites mean the first residue of a protein is often uncertain (‘X’) even in the highest quality proteomes, so these are excluded from this measurement. |
2. PubMed Publication Count |
Global |
The total number of publications related to the genome as listed for that entry in the PubMed database[153]. |
This is a measure of how well-studied a proteome is, assuming that proteomes that have been studied more will be of higher quality. |
3. CEG domain architecture inclusion |
Global |
Proportion of CEG set which contains homologous domains in the proteome, according to SUPERFAMILY |
This method assumes that all eukaryotic genomes should contain a core set of well-conserved eukaryotic genes. This score is not calculated for non-eukaryotes. This was done using the Core Eukaryotic Gene (CEG) library used by the now defunct CEGMA tool[154], which comes from the Eukaryotic Orthologous Group (KOG) sequence orthology database[155]. Domain-architecture similarity is calculated using the SUPERFAMILY HMM library. |
4. Percentage of sequences in Uniprot |
Global |
Percentage of proteome sequences that appear in Uniprot with 100% sequence identity |
This metric assumes that the majority of discrepancies between Uniprot protein sequences and the proteome protein sequences are due to proteome inaccuracies. |
5. Percentage of sequence covered |
Clade-based |
Percentage of amino acid residues in proteome sequence that are covered by SCOP domain superfamily assignments, compared to the average for the clade. |
This metric measures the portion of structured protein sequences found in the proteome as opposed to disordered regions and gaps. This measure assumes related species have a similar breakdown of these types of proteins. A mismatch could indicate that the parts of the genome that are supposed to be protein-coding are an incorrect length, that it is missing proteins, or contains proteins that it shouldn’t. |
6. Percentage of sequences with assignment |
Clade-based |
Percentage of amino acid residues in proteome that have SCOP superfamily assignment according to SUPERFAMILY, compared to the average for the clade. |
Related species are assumed to have a similar percentage of domains with SUPERFAMILY assignments to SCOP superfamilies |
7. Number of domain superfamilies |
Clade-based |
Number of proteins assigned to domain superfamilies by SUPERFAMILY compared to average for clade. |
Assignment to domain superfamilies was obtained using the SUPERFAMILY HMM Library. The number of superfamilies gives an indication of the diversity of the proteome, so a low number compared to the clade may indicate an incomplete proteome, while a high number could indicate that the proteome contains domain superfamiles that it shouldn’t. |
8. Number of domain families |
Clade-based |
Number of distinct SCOP protein domain families that are annotated to the proteome, compared to the average for the clade. |
The SCOP protein domain families are annotated to the proteome using a hybrid HMM/pairwise similarity method from the SUPERFAMILY resource. Similarly to the number of domain superfamilies, the number of families gives an indication of the diversity of the proteome at the SCOP family level. Domain families were included in addition to domain superfamilies, since they are more specific and may reveal differences that are not apparent at the superfamily level. |
9. Mean sequence length |
Clade-based |
The average length of proteins in the proteome (in amino acids), compared to the average for the clade. |
This measure assumes that mean sequence length of proteins should be comparable with those of related species. |
10. Mean hit length |
Clade-based |
Average number of amino acids in superfamily assignments, compared to the average for the clade. |
Longer hits represent better matches to SCOP domains. These are assumed to be similar for similar species. |
11. Number of domain architectures |
Clade-based |
Number of unique domain architectures (combinations of SCOP domain superfamilies and gaps) in the proteome, according to SUPERFAMILY, compared to the average for the clade. |
Similarly to the number of domain families superfamilies, the number of domain architectures gives an indication of the diversity of the proteome at the SCOP family level. |
12. DOGMA[150] |
Clade-based* |
Percentage of conserved domain arrangments found |
DOGMA compares sequences to conserved domains arrangements across six eukaryotic model species (Arabidopsis thaliana, Caenorhabditis elegans, Drosophila melanogaster, Homo sapiens, Mus musculus and Saccharomyces cerevisiae), or alternative sets for mammals, insects, bacteria and archaea. It is therefore not “clade-based” in the same way as other PQI metrics. |
3.6.2.1. DOGMA
Since the publication of the PQI paper, the DOGMA metric[150], which scores proteomes based on conserved arrangements of protein domains, has been added to the PQI website. The DOGMA score is similar to the PQI “Number of Domain Architectures” score, but since it is based on using model organisms as a ground truth, it scores these genomes highly, whereas this tends not to be the case for PQI’s clade-based metrics.
3.6.3. PQI features

Fig. 3.7 A view of the PQI website for the Haarlem strain of Myobacterium Tuberculosis. For this genome, we see the 12 different metrics with star ratings with a good overall score (4.2), compared to a clade of 47 species. It’s high overall scores in clade-based metrics show that the genome is similar to most other species in the clade.
In addition to the 11 provided metrics (each of which have individual star-ratings), the PQI website provides an overall star-rating scoring system for proteomes, bringing together numerous different metrics which are normalised before being averaged into an intuitive star-rating (1-5 stars) with equal weight given to each metric. Proteomes for particular species can be searched for, filtered by the various ratings, downloaded, user-rated and commented on. Additional proteomes and metrics can be added/suggested by users via the website and documentation describing this is provided. Fig. 3.7 shows the PQI website for a Myobacteria Tuberculosis proteome with a good overall score.
3.6.3.1. Example usage
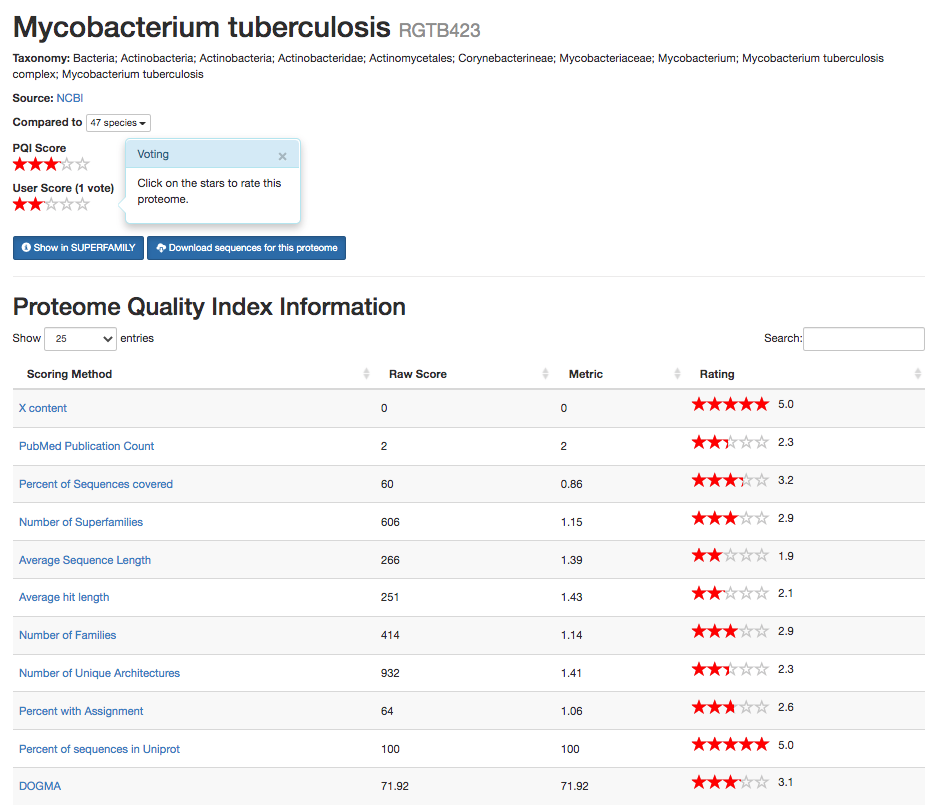
Fig. 3.8 A view of the PQI website for the RGTB423 strain of Myobacterium Tuberculosis. This time the genome has a poor overall score (3.0) according to PQI.
A typical use case for PQI would be to check the metrics of a genome before including it in analysis. Comparing Fig. 3.8 (showing the PQI website for the lower-scoring proteome) to the earlier example in Fig. 3.7, we can see that the RGTB423 strain scores considerably worse in all of the metrics associated with proteins or protein domains. For example, the average sequence length is considerably shorter in RGTB423 than in Haarlem, which makes it very unusual for the clade, meaning that the genome gets only 1.9 stars for this metric. This is indicative of the fact that the proteins in the sequenced RGTB423 strain are incomplete.
3.6.5. Limitations
There are some limitations of PQI and its metrics:
The clade-based metrics downscore unusual genomes. This backfires for unusually good genomes. Model organisms such as Homo Sapiens can get a low score in clade-based metrics for the wrong reasons; they are of unusually high quality compared to those in it’s clade. Clade-based scoring also creates irregularities in scoring for clades containing outlying species: the more diverse a clade, the worse every genome’s score within it. PQI website’s comment and user-rating features can be used to alert its users to these cases, but this remains a major limitation.
PQI’s intended audience were users of protemes/genomes, rather than creators thereof. It does therefore not release the code for others to calculate these metrics on their work-in-progress genomes/proteomes, unlike BUSCO. This may have limited PQI’s ability to positively influence proteome quality.
3.6.6. Potential improvements
3.6.6.1. Change weighting of star-rating
In order to address limitation (1), one option would be to downgrade the importance of clade-based metrics in star ratings. This could be done for all genomes, for model organisms specifically, or preferentially the more they have been sequenced and assembled. In the latter case, the Assembly database[159] could be used as a source of this information.
3.6.6.2. Changes to metrics
PQI was created with the potential to add further quality metrics by other researchers, and remains open to adding these. Here, I give three examples of metrics which would improve PQI. This list is by no means exhaustive. There could be far more additional measures to audit different types of problems in genome sequencing, for example GC content, amino acid bias, or contamination from other genomes.
Inclusion of BUSCO Although the DOGMA metric was added and it is based on BUSCO[156], it might be sensible to add BUSCO, since it has become very popular (thousands of citations), and any proteome/genome quality index would arguably be seen as incomplete without it. The continued inclusion of the CEG Domain Combination Homology metric may also be questioned since CEGMA is no longer being updated (nor is the KEG database upon which it is based). However, BUSCO and CEGMA may be complementary since BUSCO has a weaker requirement for inclusion in the set of proteins, which means that it has more proteins.
Number of assemblies In addition to using the assembly information to choose the importance of clade-based metrics, the number of assemblies for a species and number of versions of an assembly might form a metric of how well-studied an organism is, which may be useful to users.
Technology-based Some “third-generation” sequencing technologies can create much longer read lengths, but potentially lower accuracies. A third category of metrics “technology-based” metrics could exist for proteomes where the metric is only really comparable within similar types of technologies. If technology-based metrics were implemented, it may also be sensible to have some metrics which only exist for specific technologies. For example, for nanopore sequencing, we could implement an indel-based quality metric[161]. Including sequencing-technology-specific metrics may encourage contributions from other researchers who specialise in particular technologies. Sequencing technology is also available in the NCBI Assembly database[159].