Data Acquisition
Contents
7.2. Data Acquisition
This section describes the constituent data sets that were chosen for combination, and how they were chosen and acquired.
7.2.1. Criteria for choosing datasets
Datasets were chosen from the EBI’s Gene Expression Atlas (GxA)[69]: the European Bioinformatics Institutes’ Open Source gene and protein expression database, and the largest of its type. At the time of writing, it contains over 3,000 gene expression and protein abundance experiments across many organisms, organism parts (tissues), diseases, and sequencing technologies. There is a separate database for scRNA-seq experiments.
A major benefit of the GxA is that raw data using the same sequencing technology is re-analysed by GxA using the same data analysis pipeline (iRAP[265] for RNA-Seq). In addition to ensuring the quality of each data set included, and running it through the same pipeline, the GxA adds additional metadata for the experiments by using the literature to biologically and technically annotate each sample.
Data sets were chosen based on the following requirements.
Inclusion in the GxA.
Experiments must be measuring baseline, rather than differential gene expression.
Samples must be sequenced using Next Generation Sequencing, i.e. including RNA-Seq and CAGE, and excluding microarrays.
Data sets must contain a breadth of tissues and genes, i.e. experiments must include “organism part” as an experimental factor (otherwise tissue would not be recorded) and must have at least 80 assays (samples).
Samples must not be disease-focused. In practice, excluding cancer datasets was enough to exclude disease-focused datasets.
Choices (1)-(3) were made to ensure the data underwent the most similar possible analysis pipeline. Number (4) was necessary to aid batch correction by facilitating the most balanced data set design in terms of batch (experiment) to group (tissue), and in order to have good coverage of genes and tissues, which is necessary for downstream use. Choice number (5) was also made primarily to aid batch correction: since many phenotypes occur only in particular tissues, there is not a breadth of tissue measurements for most diseases.
As described in the introduction chapter, there are many ways to measure which proteins are being created. Here, I justify my choices of measures to include in the combined data set.
7.2.1.1. Gene expression vs protein abundance
As I mentioned earlier, gene expression is only weakly correlated to protein abundance. So, what are the potential reasons for this, and which makes a better measure of the process of translation?
One reason is that there is something preventing the mRNA from being translated, such as slow codons, the temperature, ribosome occupancy, or regulatory RNAs and proteins[266]. In these cases, the DNA is transcribed into mRNA, but the protein is never produced, meaning that using gene expression data as a measure of how much protein is produced would be overestimating the protein abundance. If these factors were a large contribution to the weak correlation, it could provide better results to use protein abundance data instead of mRNA abundance data to make predictions about how proteins are affecting human phenotypes. On the other hand, it could equally be possible that proteins are being produced, but not measured by protein abundance techniques. Protein half-lives range over orders of magnitude from seconds to days[266,267]. In this case, gene expression data may be a more reliable measure of protein production than protein abundance, since proteins may degrade before being measured. In yeast, protein degradation was shown to be the largest contribution to the protein-mRNA correlation compared to codon and amino acid usage (the two other factors estimated in the study), and more influential than those other two factors combined[268].
In summary, there’s no perfect measure of translation, but since gene expression data is more readily available, and protein degradation appears to account for most of the differences between correlations, gene expression data presents the best proxy for translation for the downstream uses discussed here.
7.2.1.2. Gene expression vs Transcript expression
It’s likely that transcript expression data would provide more insight than gene expression data if it were available, since it is likely that there are tissue-specific transcripts which do not correspond to tissue-specific genes, e.g. where different transcripts from the same gene are expressed in different tissues. Transcript expression data, however, is harder to come by and this approach relies on a wealth of available data. Furthermore, transcript expression data can be straightforwardly converted to gene expression data (by summing over the transcripts), while the conversion of gene to transcript expression data is decidedly less accurate. When transcript-expression (CAGE) measurements are aggregated at the gene/protein level, measures of tissue-specificity have been found to largely (75-93%) match up with measures of tissue-specificity resulting from gene-expression measurements, as found in a comparison between the HPA and FANTOM5 experiments[269].
For these reasons, I have taken a gene-centric approach here. It may be important, however, to consider whether a gene has multiple transcripts in downstream analysis, for example, if including tissue-specific gene expression information when predicting the function of a protein-coding SNP (since it may not be in the relevant transcript).
7.2.1.2.1. Tissue-specificity versus cell-specificity
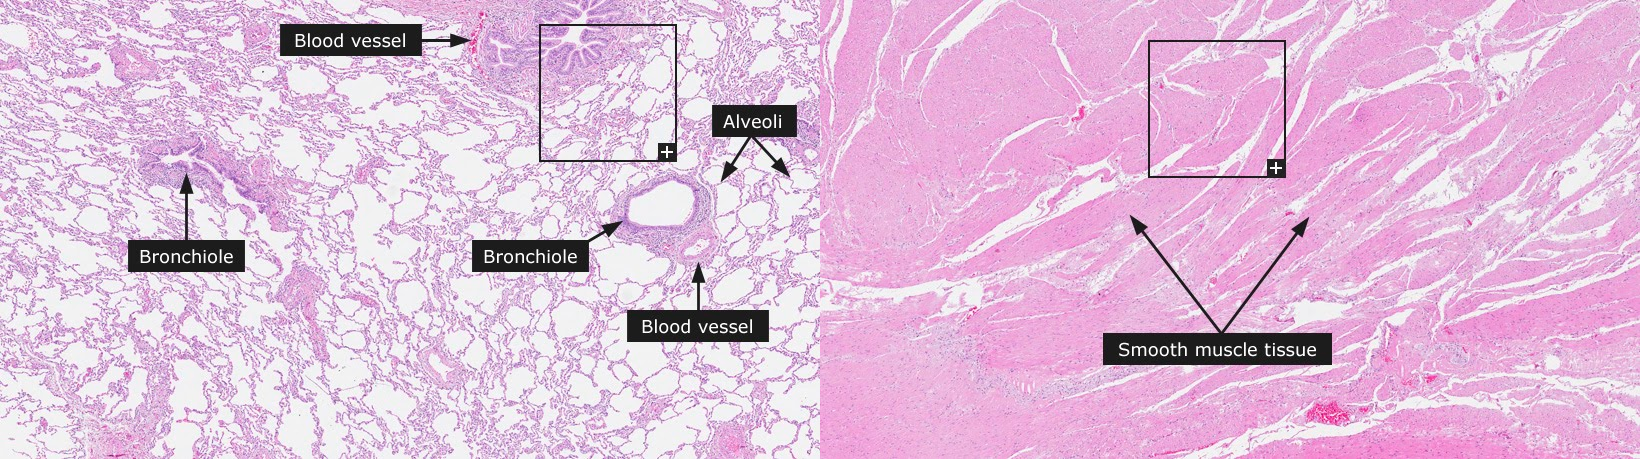
Fig. 7.1 Images of smooth muscle tissue from the stomach wall (left) and lung tissue (right), examples of homogeneous and heterogeneous tissue types respectively, taken from the Human Tissue Atlas website[270].
Tissues can be made up of various cell types. Some tissue types (e.g. smooth muscle) are quite homogeneous, comprising of predominantly one cell type and/or lacking structural features. Other tissues (e.g. lung) are heterogeneous, consisting of multiple cell types and features. Fig. 7.1 shows the different structure of two example tissue types. The bronchioles of the lung alone consist of six different cell types (basal cells, neuroendocrine cells, ciliated cells, serous cells, Clara cells and goblet cells), while smooth muscle tissue consists almost exclusively of tightly packed smooth muscle cells. The varying proportions of constituent cell types in heterogeneous tissues can influence tissue function.
While we may prefer to look at the gene expression of a cell type, we currently have much less scRNA-seq data than bulk RNA-seq data. Bulk RNA-seq also gives us the ability to measure the gene expression of tissues as they appear in humans. The average supply of a protein to a tissue (averaged over multiple cell types) may well influence a tissue’s phenotype, in these circumstances gene expression at the level of a tissue may give us information that we can’t retrieve from cell-line cells alone.
7.2.1.3. Inclusion of CAGE data
CAGE is transcript expression, rather than gene expression, and there are likely to be different transcripts measured by CAGE than by RNA-Seq. As mentioned above, however, it is possible to calculate gene expression from transcript expression. It’s also possible to map between CAGE transcription start sites and existing transcript IDs that may be featured in RNA-Seq arrays. When this is done, it has been observed that the results of CAGE are comparable to those of RNA-seq[271], so the inclusion of CAGE data in a combined data set is reasonable.
7.2.1.4. Excluding disease-focused experiments
The decision to exclude disease-focused experiments was made primarily to reduce the complexity of the analysis and the resulting data set. The data set can now be interpreted as representing gene expression of healthy tissues. This was also a practical choice since most disease data sets (with the exception of cancer datasets) tended to have a narrow breadth of tissues, which would interfere with the batch correction methodology. For example, experiments interested in heart disease would naturally contain measurements of healthy and non-healthy heart tissues, and not other tissues, so would be difficult to combine with existing data sets due to the “missing” data. This would not have been a problem for cancer experiments, however cancer samples gene expression is known to be tissue-non-specific[76,215].
7.2.2. Method of searching
It would have been preferable to interrogate the GxA for datasets using the ExpressionAtlas R package, or the AtlasExpress API which it is built on. However, it was necessary to do so via the website since searches to the AtlasExpress API cannot differentiate between baseline and differential gene expression.
For reproducibility, this was done by downloading the json file used by the GxA experiment browser webservice and by choosing experiments with:
baseline (rather than differential) expression measurements
homo sapiens species
RNA-Seq mRNA technology
organism part as an experimental factor
at least 80 assays.
no mention of “cancer” in the description
libraries <- function(){
    library(httr)
    library(jsonlite)
    library(tidyverse)
    library(plotly)
    library(IRdisplay)
    library(ExpressionAtlas)
    library(htmlwidgets)
}
suppressMessages(libraries())

analysis_date <- "2019-06-01"  #YYYY-mm-dd
min_assays <- 80

# Get information about experiments
gxa_json <- 'https://www.ebi.ac.uk/gxa/json/experiments'
req <- httr::GET(gxa_json)
text <- httr::content(req, "text", encoding="UTF-8")
gxa_experiment_info <- as_tibble(jsonlite::fromJSON(text)$experiments)

# All data at time of analysis:
gxa_experiment_info$loadDate <- as.Date(gxa_experiment_info$loadDate, "%d-%m-%Y")
gxa_experiment_info <- gxa_experiment_info %>% filter(loadDate<analysis_date)
funnel_info <- tibble(name="All experiments",
                      num_experiments=nrow(gxa_experiment_info))

# All next-gen sequencing experiments:
gxa_experiment_info<- gxa_experiment_info %>%
  filter(technologyType=='RNA-Seq mRNA')
funnel_info <- funnel_info %>%
  add_row(name="RNA-Seq technology",
          num_experiments=nrow(gxa_experiment_info))

# All baseline expression experiments
gxa_experiment_info<- gxa_experiment_info %>%
  filter(experimentType=='Baseline')
baseline <- nrow(gxa_experiment_info)
funnel_info <- funnel_info %>%
  add_row(name="Baseline experiments",
          num_experiments=nrow(gxa_experiment_info))

# All human experiments
gxa_experiment_info<- gxa_experiment_info %>%
  filter(species=='Homo sapiens')
funnel_info <- funnel_info %>%
  add_row(name="Human",
          num_experiments=nrow(gxa_experiment_info))

# All "organism part" experiments with > 80 assays:
gxa_experiment_info$experimentalFactors <- as.character(gxa_experiment_info$experimentalFactors)
gxa_experiment_info <- gxa_experiment_info %>%
  filter(numberOfAssays>min_assays,
         str_detect(experimentalFactors, 'organism part'))
funnel_info <- funnel_info %>%
  add_row(name="Contains tissues and >80 samples",
          num_experiments=nrow(gxa_experiment_info))

# Excluding cancer experiments:
gxa_experiment_info$experimentDescription <- as.character(gxa_experiment_info$experimentDescription)
gxa_experiment_info <- gxa_experiment_info %>%
  filter(str_detect(experimentDescription,'[cC]ancer', negate=TRUE))
funnel_info <- funnel_info %>%
  add_row(name="Not cancer experiments",
          num_experiments=nrow(gxa_experiment_info))


create_fig <- function(){
    fig <- plot_ly()
    fig <- fig %>% add_trace(
        type = "funnel",
        y = as.character(funnel_info$name),
        x = as.integer(funnel_info$num_experiments))
    fig <- fig %>% layout(yaxis = list(categoryarray = as.character(funnel_info$name)))
#     orca(fig, '../images/combining_funnel_static.png', width=800)
     saveWidget(fig, "../images/combining_funnel_interactive.html", selfcontained = TRUE)
#     IRdisplay::display_html(file='../images/combining_funnel_interactive.html')

}

suppressWarnings(create_fig())

Fig. 7.2 Our requirements for a data set reduce the number of eligible data sets to four.
As Fig. 7.2 shows, at the time of writing, there are over 3000 experiments in the GxA, and of these 27 are human baseline RNA-Seq experiments. Of these there are 4 which offer a good coverage of non-disease organism parts.
7.2.3. Eligible data sets
The four eligible data sets are summarised in Table 7.1, and they are described in further detail below.
|
|
|
|
|
|---|---|---|---|---|
|
|
RNA-seq of coding RNA from tissue samples of 122 human individuals representing 32 different tissues |
200 |
organism part |
|
|
RNA-Seq CAGE (Cap Analysis of Gene Expression) analysis of human tissues in RIKEN FANTOM5 project |
96 |
developmental stage, organism part |
|
|
RNA-seq from 53 human tissue samples from the Genotype-Tissue Expression (GTEx) Project |
18736 |
organism part |
|
|
RNA-seq of coding RNA: Human Developmental Biology Resource (HDBR) expression resource of prenatal human brain development |
613 |
developmental stage, organism part |
7.2.3.1. FANTOM5
opI used the FANTOM5 data, as described in Section 5.3.1.
7.2.3.2. Human Protein Atlas
The Human Protein Atlas (HPA) project[272,273] aims to map all human proteins in cells (including subcellular locations), tissues and organs. The HPA project’s data is not limited to the gene expression data that can be found in GxA, but that is the only part of the data that is used here. The gene expression data that was used (E-MTAB-2836 in GxA) excludes cell lines and includes tissue samples of 122 individuals and 32 different non-diseased tissue types.
7.2.3.3. Genotype Tissue Expression
The Genotype Tissue Expression (GTEx) project[274] was developed specifically for the purpose of studying tissue-specific gene expression in humans and gene expression data from over 18,000 samples, including 53 non-diseased tissue types and 550 individuals (ranging in age from 20s to 70s).
7.2.3.4. Human Developmental Biology Resource
The Human Developmental Biology Resource (HDBR) Expression data[275] is slightly different from the other data sets in that contains a much narrower range of sample types. All HDBR samples are human brain samples at different stages of development, ranging from 3 to 20 weeks after conception.
7.2.4. Data acquisition
Data was obtained, where possible via the ExpressionAtlas R package[276], which gives gene expression counts identified by ENSG IDs, metadata (containing pipeline, filtering, mapping and quantification information), and details of experimental design (containing for example organism part name, individual demographics, and replicate information, depending on the experiment).
For the FANTOM experiment, counts for transcript expression were downloaded directly from the FANTOM website.
The downloaded FANTOM5 file has already undergone some quality control by FANTOM, it is limited to peaks which meet a “robust” threshold (>10 read counts and 1TPM for at least one sample).
The data acquisition code is not executed in this notebook as it is slow to download all the files, but the R script to do so can be downloaded here.